No More Memory Leaks: The Pro Strategies
5 min readMemory leaks are well-known challenges in the software engineering domain, affecting both seasoned professionals and leading-edge enterprise solutions. If you ask some industry veterans, they probably have some war stories to share about battling memory leaks. A few years back, the esteemed ElasticSearch team publicly detailed their struggles with memory leaks in the Elastic Cloud service. Their documentation has provided insightful revelations into the complexities of identifying and addressing memory leaks.
Java's garbage collection might lead you to believe memory leaks are a non-issue. Unfortunately, they happen! The fact is, memory leaks can and do occur, often leading to out-of-memory errors, resource depletion and performance degradation. Understanding and avoiding these leaks are crucial for maintaining robust and efficient Java applications.
In this article, we'll break down the common ways memory leaks sneak into Java applications and provide you with the strategies to prevent them, safeguarding your application's performance.
Understanding Memory Leaks
In Java, the garbage collector (GC) plays a crucial role in memory management by automatically freeing up memory used by objects that are no longer reachable from any live threads or static references. However, this automated system is not infallible.
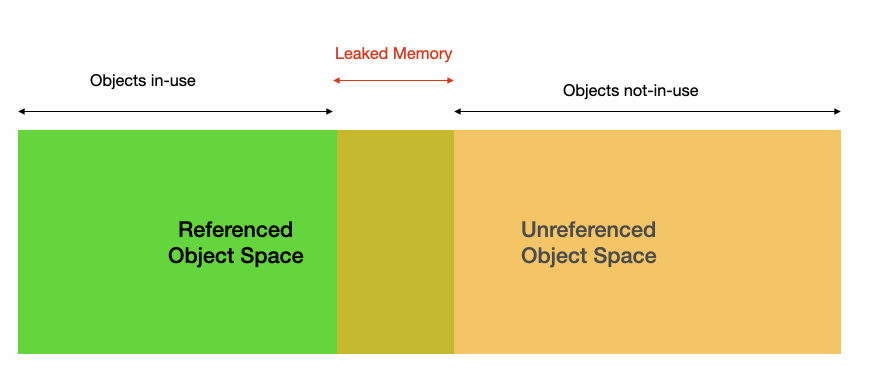
Memory leaks can occur when objects that are no longer needed continue to be held in memory because they are still referenced, intentionally or unintentionally, preventing the GC from reclaiming that memory space.
Symptoms of Memory Leak
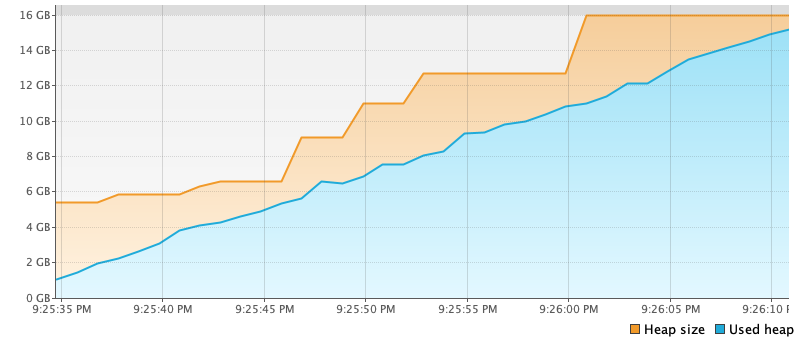
There are so many various symptoms that may indicate memory leaks. For instance,
- Memory usage continuously grow over time while application running without a corresponding increase in application activity or data processing
- Performance degradation gradually over time
- Unexpected application crashes, or OutOfMemory error with sufficient allocations
- An increase in garbage collection activity and long stop-the-world pauses
Common pitfalls
Common sources include static fields, listeners and callbacks, caches, and improper use of collections.
Static Fields
Static fields can be a source of memory leaks if not used carefully. Since their lifecycle is tied to the class, they can retain objects long after they're needed.
public class ExampleClass {
    private static List<Object> list = new ArrayList<>();

    public void add(Object object) {
        list.add(object); // Objects added here will stay until the class is unloaded, potentially leading to memory leaks.
    }
}
A common practice is to minimize the use of static fields or ensure they are cleared appropriately when no longer needed.
Listeners and Callbacks
Listeners and callbacks, if not unregistered, can lead to memory leaks, especially in GUI applications or when using external resources.
public class SomeListener implements EventListener {
    public void register() {
        SomeEventSource.addListener(this);
    }

    public void unregister() {
        SomeEventSource.removeListener(this);
    }
}


private ExampleListener listener = new ExampleListener();
public void process() {
   listener.register();
   doProcess();
}
Based on this example, the common way to deal with memory leak is to always unregister listeners and callbacks when they are no longer needed.
Caches
The idea might seem similar to the static field concept; however, poorly managed caches can expand endlessly, resulting in memory leaks as well
public class Cache<K, V> {
    private Map<K, V> cache = new HashMap<>();

    public void put(K key, V value) {
        cache.put(key, value);
    }

    public V get(K key) {
        return cache.get(key);
    }
}
In-memory locally implemented cache could see such issue. One way to handle this, is to use a WeakHashMap or libraries like Guava Cache for cache management to allow garbage collection of cache entries.
Improper Use of Collections
Collections can lead to memory leaks if objects are not removed after they're no longer needed.
public class CollectionExample {
    private List<Object> list = new ArrayList<>();

    public void add(Object object) {
        list.add(object);
    }

    public void clear() {
        list.clear(); // Forgetting to clear or remove objects from collections can lead to memory leaks.
    }
}
One general advice is to be diligent in managing collections, removing objects when they're no longer needed.
Detecting Memory Leaks
Identifying memory leaks can be tricky, but the right tools make the process much easier. Let's look at some popular options and how to use them.
Profiling Tools
One common toolkit is the VisualVM that bundled with the JDK. It provides a real-time view of memory usage, CPU, threads, and more. It allows to take heap dumps and use the snapshot to analyze for potential leaks, by looking for objects that persist unexpectedly in the heap.
There are also commercial applications available, such as YourKit Java Profiler. These options provide advanced profiling capabilities with memory and CPU analysis, object inspection, and more. Some also provides leakage detection through object allocation tracking and detailed reports.
Heap Analysis Tools
Common ways include the Eclipse Memory Analyzer (MAT), and JProfiler, that allows developers to analyze dumps that generated through visualVM or jmap; or through heap walking, object graph analysis, and advanced leak detection features.
GC Log Analysis
Log analysis usually comes in handy. Look out for signs of trouble, such as frequent full garbage collections, increased pause time for GC, or a heap that steadily grows without reclamation. There are also toolkit helping with this, such as GCViewer, HPjmeter, and others.
From the application, enable GC logging by adding this into command-line -XX:+PrintGCDetails -XX:+PrintGCTimeStamps -Xloggc:<file_name>
Other Important ones
Industry experts agree that fixing memory leaks requires detailed analysis of the application before releasing the code. A common method is to include memory leak detection in code reviews and use automated tests to find leaks early in development.
There are also code analysis tools designed to detect problems such as unclosed resources, unused references in collections, or incorrect use of static variables, like FindBugs and PMD. The main goal is to catch potential memory leaks during development.
Summary
Preventing memory leaks in Java demands careful attention and a solid grasp of object management. Adhering to the recommended practices and utilizing tools for memory analysis, developers can have better confidence that their Java applications will operate smoothly and leak-free. It's important to remember that prevention surpasses cure. And monitoring memory management from the start beginning can significantly reduce troubleshooting efforts later.
Have you tackled a challenging memory leak issue? We'd love to hear about your experience!
